
McKenzie, Tennessee
Population, housing costs, incomes, jobs, commuting and climate in McKenzie, compared with Tennessee and the U.S. using Census records and their margins of error.
McKenzie city · Incorporated city · Census GEOID 4744940 · Tennessee directory
- Population · July 1, 2025
- 5,632 PEP Vintage 2025
- Change · 2024 to 2025
- +0.1% +8 residents
- Household income
- $37,236 ACS 2020–2024 · ±$11,430
- Home value
- $154,500 ACS 2020–2024 · ±$19,083
- Monthly gross rent
- $663 ACS 2020–2024 · ±$68
- Median age
- 32.9 years ACS 2020–2024 · ±3.0
McKenzie is an incorporated city in Carroll County, Henry County and Weakley County, Tennessee. With 5,632 residents on July 1, 2025, it ranks 99th in Tennessee and 4,579th nationally among Census places. Its population grew by 8 (0.1%) in the year to July 2025; since April 2020 it has grown 1.9%. Median gross rent in the 2020–2024 survey is $663 a month, 44.2% below the Tennessee median. Median household income is $37,236, 46.5% below the Tennessee median.
Detailed demographics → Housing and cost-of-living context →
What stands out in McKenzie?
Compared with other Tennessee places, McKenzie is most distinctive for weaker local job growth, lower household incomes and a younger population. Each statement below uses reliable estimates only, and survey differences from the state exceed their combined 90% margin of error.
- Change in local jobs since 2019: -35.3%; lower than 96% of 230 Tennessee places with reliable estimates. Only 8 of 230 Tennessee places with reliable estimates are lower.
- Median household income: $37,236, 46.5% below the Tennessee median ($69,595); lower than 94% of 316 Tennessee places with reliable estimates.
- Median age: 32.9 years, 6.0 years younger than the Tennessee median (38.9 years); lower than 90% of 340 Tennessee places with reliable estimates.
- Median gross rent: $663, 44.2% below the Tennessee median ($1,189); lower than 88% of 299 Tennessee places with reliable estimates.
- Households with a broadband subscription: 80.1%, 9.1 percentage points below the Tennessee rate (89.2%); lower than 84% of 342 Tennessee places with reliable estimates.
How McKenzie compares with Tennessee and the U.S.
| Measure | McKenzie | Tennessee | U.S. | Position in Tennessee |
|---|---|---|---|---|
| Population change since April 2020 PEP Vintage 2025 | +1.9% | — | — | lower than 61% of 342 Tennessee places |
| Residents per square mile of land PEP 2025 / Gazetteer 2025 | 884 | — | — | higher than 72% of 345 Tennessee places |
| Median household income B19013 | $37,236 ±$11,430 | $69,595 | $80,734 | lower than 94% of 316 Tennessee places |
| Median home value B25077 | $154,500 ±$19,083 | $286,700 | $332,700 | lower than 72% of 326 Tennessee places |
| Median real estate taxes paid B25103 | $825 ±$209 | $1,442 | $3,119 | lower than 62% of 327 Tennessee places |
| Median gross rent B25064 | $663 ±$68 | $1,189 | $1,413 | lower than 88% of 299 Tennessee places |
| Renters paying 30%+ of income on rent B25070 | 64.2% ±18.0 pp | 48.8% | 51.1% | higher than 92% of 176 Tennessee places |
| Homeownership rate B25003 | 60.0% ±5.0 pp | 66.9% | 65.2% | lower than 67% of 339 Tennessee places |
| Median age B01002 | 32.9 years ±3.0 | 38.9 years | 38.9 years | lower than 90% of 340 Tennessee places |
| Adults 25+ with a bachelor’s degree or higher B15003 | 20.0% ±5.3 pp | 31.1% | 35.7% | higher than 51% of 254 Tennessee places |
| Poverty rate B17001 | 21.2% ±7.2 pp | 13.8% | 12.5% | higher than 59% of 189 Tennessee places |
| People without health insurance B27010 | 10.8% ±3.7 pp | 10.0% | 8.4% | higher than 54% of 189 Tennessee places |
| Households with a broadband subscription B28002 | 80.1% ±3.5 pp | 89.2% | 91.0% | lower than 84% of 342 Tennessee places |
| Unemployment rate (civilian labor force) B23025 | 4.0% ±2.5 pp · low precision | 4.7% | 5.2% | Not ranked: low precision |
| Foreign-born residents B05002 | 4.0% ±2.1 pp · low precision | 6.1% | 14.1% | Not ranked: low precision |
| Jobs located in the place per 100 residents LODES 8.4 / PEP | 37.3 | — | — | lower than 60% of 258 Tennessee places |
| Change in local jobs since 2019 LODES 8.4 | -35.3% | — | — | lower than 96% of 230 Tennessee places |
| Workers who work from home B08301 | 8.2% ±3.8 pp | 12.9% | 15.1% | lower than 83% of 106 Tennessee places |
| Commutes of 45 minutes or longer B08303 | 9.5% ±5.3 pp · low precision | 15.2% | 16.5% | Not ranked: low precision |
| Households without a vehicle B08201 | 10.8% ±7.3 pp · low precision | 5.2% | 8.4% | Not ranked: low precision |
Positions compare McKenzie with Tennessee places in this directory whose estimate has a coefficient of variation of 30% or less (survey measures) or a published PEP value. The marker runs from the lowest value (left) to the highest (right); it is a description, not a score or a recommendation. 4 measures are shown in grey because the survey margin of error is too wide to rank reliably.
How many people live in McKenzie?
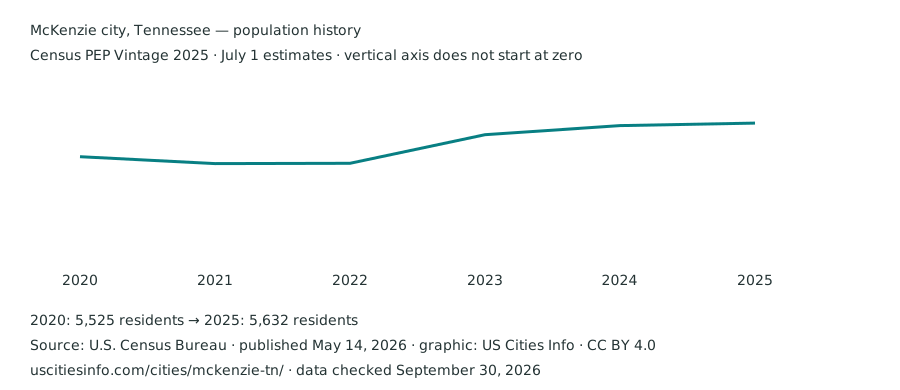
The latest official estimate is 5,632 residents on July 1, 2025. It ranks 4,579th by population nationally and 99th in Tennessee among this directory’s PEP places. Population changed by 8 residents between the 2024 and 2025 estimates. These are annual estimates, not census enumerations.
| Reference date | Population | Change from previous estimate |
|---|---|---|
| July 1, 2020 | 5,525 | Separate from April 2020 base |
| July 1, 2021 | 5,503 | -22 |
| July 1, 2022 | 5,504 | +1 |
| July 1, 2023 | 5,595 | +91 |
| July 1, 2024 | 5,624 | +29 |
| July 1, 2025 | 5,632 | +8 |
From the revised April 2020 base to July 2025, the change is +105 residents (1.9%). This is a within-vintage comparison. Boundary adjustments can affect both the estimates and their interpretation.
Download this population chart (SVG) · Official population release
Where are the boundaries?
- Entity and stable identifier
- McKenzie city, Tennessee · Incorporated city · 4744940
- Counties or equivalents · 2025 boundaries
- Carroll County ; Henry County ; Weakley County
- Metropolitan or micropolitan context · July 2023 delineations
- Paris, TN — Micropolitan Statistical Area ; Martin, TN — Micropolitan Statistical Area ; county parts without a listed association: Carroll County County associations use Census PEP county place parts. Each county is matched by FIPS code to the official CBSA list; a city can span several counties or statistical areas. A missing association can reflect an area outside a CBSA or changed county codes between vintages. City figures on this page remain place-level statistics.
- Land area
- 6.4 square miles · 2025 Gazetteer
- Water area
- 0.0 square miles · 2025 Gazetteer
- Approximate population density
- 884 residents per square mile of land
- Internal point
- 36.136643°, -88.507107° · Census geographic reference point
Density divides the July 2025 estimate by 2025 Gazetteer land area, so it is approximate. The internal point is a locator, not an address. Census place profile reference .
Income and poverty
| Measure / survey universe | City estimate ± MOE | State estimate ± MOE | U.S. estimate ± MOE |
|---|---|---|---|
| Median household income Households · USD/year | $37,236 ±$11,430 | $69,595 ±$429 | $80,734 ±$166 |
| Per-capita income Total population · USD/year | $23,619 ±$3,063 | $39,437 ±$230 | $44,673 ±$122 |
| Category | Count ± MOE | Share ± MOE (pp) |
|---|---|---|
| Below the poverty level | 1,035 ±353 | 21.2% ±7.2 pp |
Household income combines the incomes of everyone in a household; per-capita income divides all income by every resident. The poverty rate is 21.2% (±7.2 percentage points) under the official Census definition.
Home values, rent and tenure
| Measure / survey universe | City estimate ± MOE | State estimate ± MOE | U.S. estimate ± MOE |
|---|---|---|---|
| Median owner-occupied home value Owner-occupied housing units · USD | $154,500 ±$19,083 | $286,700 ±$1,492 | $332,700 ±$236 |
| Median gross rent Renter-occupied units paying cash rent · USD/month | $663 ±$68 | $1,189 ±$7 | $1,413 ±$2 |
| Category | Count ± MOE | Share ± MOE (pp) |
|---|---|---|
| Owner occupied | 1,313 ±173 | 60.0% ±5.0 pp |
| Renter occupied | 874 ±198 | 40.0% ±8.1 pp |
Owner-occupied units make up 60.0% of occupied housing. Gross rent includes estimated tenant-paid utilities and home values are owners’ own estimates; both cover 2020–2024 leases and homes rather than current listings. The median home value is 4.1 times the median household income.
See housing units, occupancy, rent burden and homeowner costs .
Monthly rent by bedroom count
| Bedrooms | Monthly gross rent | 90% margin of error | Precision |
|---|---|---|---|
| No bedroom (studio) | Unavailable | Unavailable | Unavailable |
| 1 bedroom | $547 | ±$34 | Estimate with MOE |
| 2 bedrooms | $682 | ±$39 | Estimate with MOE |
| 3 bedrooms | $875 | ±$423 | Estimate with MOE |
| 4 bedrooms | Unavailable | Unavailable | Unavailable |
| 5 or more bedrooms | Unavailable | Unavailable | Unavailable |
Census table B25031 describes renter-occupied units paying cash rent within this exact place geography. Gross rent includes contract rent and estimated tenant-paid utilities. These survey medians include existing leases across 2020–2024; they are not current apartment listings. Missing categories stay unavailable, and open-ended medians remain ranges. Small bedroom categories can have large margins of error. Download source values and provenance .
Employment among residents
| Category | Count ± MOE | Share ± MOE (pp) |
|---|---|---|
| In the labor force | 2,428 ±320 | 52.1% ±6.1 pp |
| Not in the labor force | 2,231 ±256 | 47.9% ±4.7 pp |
| Category | Count ± MOE | Share ± MOE (pp) |
|---|---|---|
| Civilian employed | 2,330 ±322 | 96.0% ±4.0 pp |
| Civilian unemployed | 98 ±62 · low precision | 4.0% ±2.5 pp · low precision |
These estimates describe residents of McKenzie wherever they work; jobs at workplaces inside the city appear under jobs located in McKenzie. They are 2020–2024 averages, not a current monthly unemployment rate.
Which industries employ residents?
Education, health care and social assistance is the largest of the published broad industry groups among employed residents: 33.0% (768 people; ±7.4 percentage points). The estimate covers residents’ industries wherever they work, rather than employers located inside the place.
| Category | Count ± MOE | Share ± MOE (pp) |
|---|---|---|
| Agriculture, forestry, fishing, hunting and mining | 22 ±32 · low precision | 0.9% ±1.4 pp · low precision |
| Construction | 127 ±80 · low precision | 5.5% ±3.4 pp · low precision |
| Manufacturing | 402 ±142 | 17.3% ±5.6 pp |
| Wholesale trade | 4 ±22 · low precision | 0.2% ±0.9 pp · low precision |
| Retail trade | 396 ±190 | 17.0% ±7.8 pp |
| Transportation, warehousing and utilities | 34 ±34 · low precision | 1.5% ±1.5 pp · low precision |
| Information | 61 ±55 · low precision | 2.6% ±2.3 pp · low precision |
| Finance, insurance, real estate, rental and leasing | 84 ±69 · low precision | 3.6% ±2.9 pp · low precision |
| Professional, scientific, management, administrative and waste services | 78 ±50 · low precision | 3.3% ±2.1 pp · low precision |
| Education, health care and social assistance | 768 ±203 | 33.0% ±7.4 pp |
| Arts, entertainment, recreation, accommodation and food services | 218 ±103 | 9.4% ±4.2 pp |
| Other services, except public administration | 19 ±17 · low precision | 0.8% ±0.7 pp · low precision |
| Public administration | 117 ±88 · low precision | 5.0% ±3.7 pp · low precision |
Occupations among employed residents
| Category | Count ± MOE | Share ± MOE (pp) |
|---|---|---|
| Management, business, science and arts | 670 ±169 | 28.8% ±6.1 pp |
| Service occupations | 558 ±178 | 23.9% ±6.9 pp |
| Sales and office | 369 ±118 | 15.8% ±4.6 pp |
| Natural resources, construction and maintenance | 175 ±97 · low precision | 7.5% ±4.0 pp · low precision |
| Production, transportation and material moving | 558 ±201 | 23.9% ±8.0 pp |
| Category | Count ± MOE | Share ± MOE (pp) |
|---|---|---|
| Management occupations | 96 ±78 · low precision | 4.1% ±3.3 pp · low precision |
| Computer and mathematical occupations | 9 ±24 · low precision | 0.4% ±1.0 pp · low precision |
| Educational instruction and library occupations | 288 ±133 | 12.4% ±5.4 pp |
| Health practitioners and technical occupations | 93 ±64 · low precision | 4.0% ±2.7 pp · low precision |
| Sales and related occupations | 193 ±102 · low precision | 8.3% ±4.2 pp · low precision |
| Transportation occupations | 100 ±60 · low precision | 4.3% ±2.5 pp · low precision |
The detailed groups are subsets of the broad groups and should not be added to them.
How residents get to work
| Category | Count ± MOE | Share ± MOE (pp) |
|---|---|---|
| Drove alone | 1,574 ±255 | 70.3% ±5.7 pp |
| Carpooled | 119 ±81 · low precision | 5.3% ±3.5 pp · low precision |
| Public transportation | 0 ±20 · low precision | 0.0% ±0.9 pp · low precision |
| Taxi or ride-hailing | 0 ±20 · low precision | 0.0% ±0.9 pp · low precision |
| Motorcycle | 0 ±20 · low precision | 0.0% ±0.9 pp · low precision |
| Bicycle | 0 ±20 · low precision | 0.0% ±0.9 pp · low precision |
| Walked | 249 ±201 · low precision | 11.1% ±8.8 pp · low precision |
| Other means | 114 ±105 · low precision | 5.1% ±4.6 pp · low precision |
| Worked from home | 184 ±89 | 8.2% ±3.8 pp |
| Category | Count ± MOE | Share ± MOE (pp) |
|---|---|---|
| Under 15 minutes | 968 ±277 | 47.1% ±11.7 pp |
| 15–29 minutes | 637 ±182 | 31.0% ±7.7 pp |
| 30–44 minutes | 255 ±109 | 12.4% ±5.0 pp |
| 45–59 minutes | 30 ±28 · low precision | 1.5% ±1.3 pp · low precision |
| 60 minutes or longer | 166 ±109 · low precision | 8.1% ±5.2 pp · low precision |
| Category | Count ± MOE | Share ± MOE (pp) |
|---|---|---|
| No vehicle available | 236 ±161 · low precision | 10.8% ±7.3 pp · low precision |
Travel times cover workers who did not work from home. Vehicle availability is counted per household, not per driver.
Households and residents
Median age is 32.9 years (±3.0). The demographic profile covers age groups, race and Hispanic origin, household types, nativity, languages, education and moves, each compared with Tennessee and the U.S.
How many jobs are located in McKenzie?
Employers in McKenzie reported 2,085 jobs in 2023, -35.3% compared with 2019 (3,223 jobs). That is 37.3 jobs for every 100 residents in the July 2023 population estimate. These are jobs at workplaces inside the city limits, wherever the workers live, unlike resident employment figures.
| Industry | Jobs | Share of local jobs | Tennessee share |
|---|---|---|---|
| Accommodation and food services | 388 | 18.6% | 9.4% |
| Educational services | 383 | 18.4% | 7.9% |
| Health care and social assistance | 303 | 14.5% | 13.7% |
| Manufacturing | 234 | 11.2% | 11.5% |
| Retail trade | 227 | 10.9% | 10.8% |
| Information | 92 | 4.4% | 1.9% |
| Public administration | 89 | 4.3% | 4.3% |
| Finance and insurance | 73 | 3.5% | 3.9% |
| Wholesale trade | 71 | 3.4% | 4.2% |
| Construction | 50 | 2.4% | 4.9% |
| Other services, except public administration | 47 | 2.3% | 2.6% |
| Administrative, support and waste management services | 43 | 2.1% | 7.3% |
| Real estate and rental and leasing | 28 | 1.3% | 1.4% |
| Arts, entertainment and recreation | 20 | 1.0% | 1.4% |
| Utilities | 19 | 0.9% | 0.6% |
| Professional, scientific and technical services | 13 | 0.6% | 5.5% |
| Agriculture, forestry, fishing and hunting | 5 | 0.2% | 0.2% |
| Group | Jobs | Share | Tennessee share |
|---|---|---|---|
| $1,250 a month or less | 604 | 29.0% | 17.3% |
| $1,251 to $3,333 a month | 752 | 36.1% | 26.9% |
| More than $3,333 a month | 729 | 35.0% | 55.8% |
| Age 29 or younger | 601 | 28.8% | 24.3% |
| Age 30 to 54 | 961 | 46.1% | 52.6% |
| Age 55 or older | 523 | 25.1% | 23.1% |
Accommodation and food services is the largest sector for jobs located in McKenzie (18.6% of local jobs, compared with 9.4% statewide). Earnings bands describe what each job pays per month, not household income, and a worker can hold more than one job.
Source: Census LEHD Origin-Destination Employment Statistics (LODES) 8.4, workplace area characteristics, all jobs, second-quarter reference date. Census blocks are summed to 2024 place boundaries. Includes private, state and local government and federal civilian jobs; excludes self-employment, military and informal work. Counts include confidentiality noise and are less precise for small places.
Nearby station climate normals
HUNTINGDON WTP, TN (NOAA station USC00404417) is approximately 16.6 km from this place’s Census internal point. The table describes that station’s 1991–2020 climate normals, using NOAA’s corrected version 1.0.1. It is historical station context, rather than a forecast or an average across the city.
| Month | Average daily high (°F) | Average daily low (°F) | Precipitation (inches) |
|---|---|---|---|
| January | 47.0 | 28.2 | 4.18 |
| February | 51.8 | 30.6 | 4.58 |
| March | 61.1 | 38.4 | 5.45 |
| April | 71.3 | 47.1 | 5.25 |
| May | 79.1 | 57.3 | 5.91 |
| June | 86.3 | 65.8 | 4.66 |
| July | 89.2 | 69.3 | 4.74 |
| August | 88.8 | 67.4 | 3.60 |
| September | 83.1 | 59.4 | 3.49 |
| October | 72.2 | 47.3 | 3.99 |
| November | 59.8 | 37.2 | 4.72 |
| December | 50.1 | 31.0 | 5.35 |
Station location: 36.0028°, -88.4253°; elevation 134.1 meters. We select the nearest station within 25 km with all 12 months of high/low temperature and precipitation marked “S” (standard) by NOAA. Standard normals meet NOAA’s data-availability rules and can include estimated missing months. Distance is a straight-line great-circle calculation from the Census internal point. Coastal exposure, elevation and urban conditions can differ between the station and an address. NOAA normals and definitions · Original station CSV · Retained station data, flags and matching details .
Check a specific address before moving
City averages help compare places. A particular home’s school assignment, transit service and flood-map coverage need checks at the address.
- FEMA Flood Map Service Center — search the address, read the effective map and its date, and check any map changes. An unmapped location does not establish an absence of flood risk.
- NCES public school district directory — find district contact information, then use the district’s official address locator or enrollment office to confirm school assignment. A city name or district boundary alone does not assign a school.
- FCC National Broadband Map — check reported service at the exact location, then confirm availability and terms with the provider.
- Check the official transit operator’s route map and timetable for the address and your actual travel hours; the citywide commuting shares above do not measure service on a particular street.
Sources and data notes
Population: Census PEP Vintage 2025, published May 14, 2026. Survey measures: ACS 2020–2024 five-year estimates, published January 29, 2026, dollar figures in 2024 dollars. Geography: Census 2025 Gazetteer, with simplified 2024 state outlines for the locator. Statistical estimates and derived values use the same retained records in profiles, comparison, filters and downloads.
Climate uses NOAA 1991–2020 station normals (v1.0.1); jobs located in the city use LEHD LODES 8.4. Crime, school assignments and hazard scores are not inferred from these datasets, and missing values are never treated as zero. Inspect original sources, read calculation details, download this place’s source observations , or submit a correction.