
U.S. City Data and Downloads
Download national and state city population CSV files, detailed survey observations, source manifests and reusable population charts.
The population downloads cover 19,483 PEP places in all 50 states and D.C. National survey downloads retain 9,737,967 direct city estimates and their source margins of error, plus compatible state and national benchmark rows. The files retain geographic identifiers and periods so population and survey estimates can be kept distinct.
Ranking tables and article datasets
Each dedicated ranking exports all rows matching its filters, with the original national rank, source and uncertainty. The city research articles add interactive comparisons, CSV exports and source-labeled SVG charts. These derived views use the same retained observations as the city profiles; their criteria and denominators are documented on each page.
National files
- All PEP place population records (CSV) — July estimates 2020–2025, revised April 2020 base, annual change and ranks.
- National survey observation index (JSON) — links to each place’s source-cell file. The normalized per-place files retain original estimates and uncertainty; their shared dictionary records labels, units, universes and source URLs.
- Source-file manifest (JSON) — original URLs, hashes, release metadata and retained geographies.
- National comparison place index (JSON) — every selectable place and its exact geographic identifier. Individual comparison files load only for the places selected.
Housing and survey files
Bedroom rents, county/metro associations and nearby station normals (JSON) retain ACS B25031 estimates and MOEs, PEP county place parts, July 2023 CBSA associations and NOAA 1991–2020 monthly station normals. Shared dictionaries identify counties, statistical areas and stations; metadata preserves the original URLs, checksums, native periods, units and matching criteria. Climate cells retain measurement/completeness flags and years used. A missing station or geographic association remains null.
Property taxes and jobs located in each place (JSON) retain ACS B25103 estimates and MOEs for places, states and the U.S., and LODES 8.4 workplace job counts by industry, monthly earnings band and worker age for each matched place and state, with source URLs, checksums, years and field order.
Housing age and type, household incomes, health insurance, internet and veterans (JSON) retain ACS 2020–2024 tables B25034, B25035, B25024, B25041, B19001, B27010, B28002 and B21001 as published estimate and MOE strings for every matched place, state and the U.S., with kept cell labels, open-ended medians, source URLs and checksums.
Income, home value and rent files retain original numeric source codes and range qualifiers. A code such as 3501 means rent of at least $3,500, rather than an exact $3,501 median; see open-ended median ranges.
- National income, home value and rent medians (CSV) — includes 90% margins of error, geographic identifiers and source periods. Missing values remain blank.
- Survey table dictionary (JSON) — cell labels, source universes, units and original table URLs.
- United States survey benchmarks (JSON) — the same tables and period used on city profiles.
Each city profile links its own source-cell download. State benchmarks use /downloads/survey/0400000USSS.json, where SS is the two-digit
state FIPS code. Place files use /downloads/survey/1600000USSSPPPPP.json, where SS plus PPPPP is
the seven-digit place GEOID. The observation index lists all available file
paths.
State population files
- Alabama CSV 463 place records
- Alaska CSV 149 place records
- Arizona CSV 91 place records
- Arkansas CSV 501 place records
- California CSV 483 place records
- Colorado CSV 272 place records
- Connecticut CSV 30 place records
- Delaware CSV 57 place records
- District of Columbia CSV 1 place records
- Florida CSV 411 place records
- Georgia CSV 538 place records
- Hawaii CSV 1 place records
- Idaho CSV 198 place records
- Illinois CSV 1,294 place records
- Indiana CSV 566 place records
- Iowa CSV 939 place records
- Kansas CSV 625 place records
- Kentucky CSV 418 place records
- Louisiana CSV 305 place records
- Maine CSV 23 place records
- Maryland CSV 157 place records
- Massachusetts CSV 58 place records
- Michigan CSV 533 place records
- Minnesota CSV 856 place records
- Mississippi CSV 299 place records
- Missouri CSV 936 place records
- Montana CSV 127 place records
- Nebraska CSV 528 place records
- Nevada CSV 19 place records
- New Hampshire CSV 13 place records
- New Jersey CSV 323 place records
- New Mexico CSV 105 place records
- New York CSV 594 place records
- North Carolina CSV 549 place records
- North Dakota CSV 355 place records
- Ohio CSV 924 place records
- Oklahoma CSV 591 place records
- Oregon CSV 240 place records
- Pennsylvania CSV 1,014 place records
- Rhode Island CSV 8 place records
- South Carolina CSV 271 place records
- South Dakota CSV 310 place records
- Tennessee CSV 345 place records
- Texas CSV 1,224 place records
- Utah CSV 255 place records
- Vermont CSV 39 place records
- Virginia CSV 227 place records
- Washington CSV 281 place records
- West Virginia CSV 230 place records
- Wisconsin CSV 608 place records
- Wyoming CSV 99 place records
Population charts for every place
Every city profile includes a downloadable population-history SVG with source and period labels. These examples provide a starting point; the remaining charts are linked directly from their place profiles.
- New York, New York — population history (SVG)
- Los Angeles, California — population history (SVG)
- Chicago, Illinois — population history (SVG)
- Houston, Texas — population history (SVG)
- Phoenix, Arizona — population history (SVG)
- Seattle, Washington — population history (SVG)
- Denver, Colorado — population history (SVG)
- Austin, Texas — population history (SVG)
- San Antonio, Texas — population history (SVG)
- Raleigh, North Carolina — population history (SVG)
- Madison, Wisconsin — population history (SVG)
- Pittsburgh, Pennsylvania — population history (SVG)
- Urban Honolulu, Hawaii — population history (SVG)
- Anchorage, Alaska — population history (SVG)
- Boston, Massachusetts — population history (SVG)
- Miami, Florida — population history (SVG)
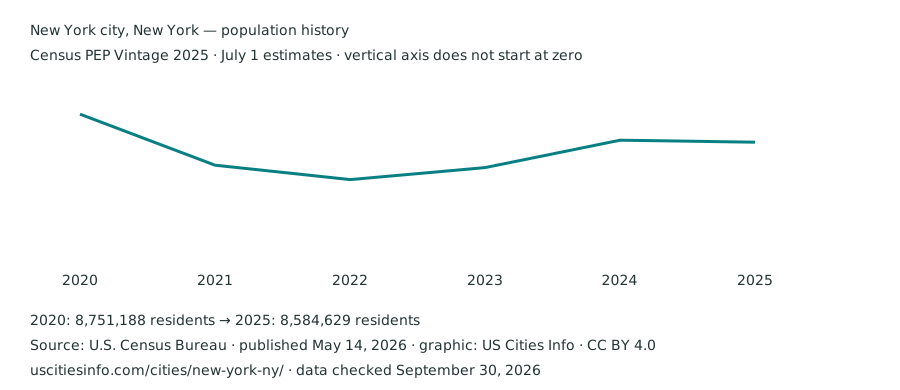
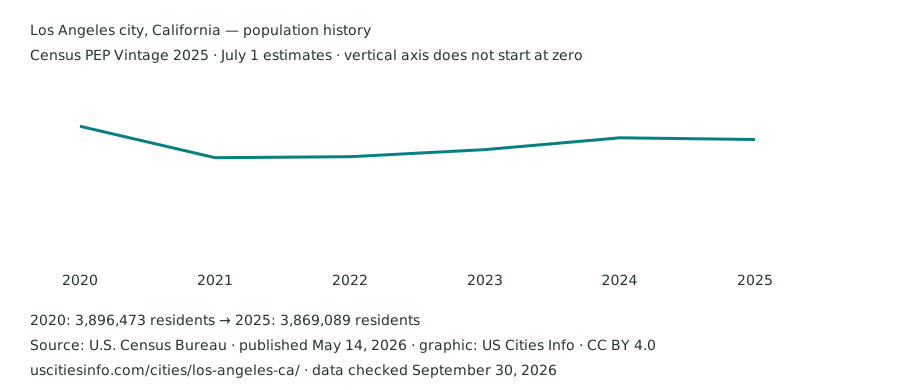
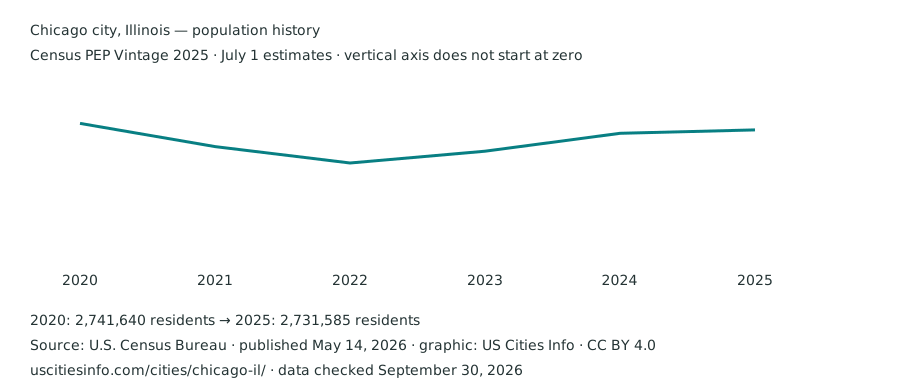
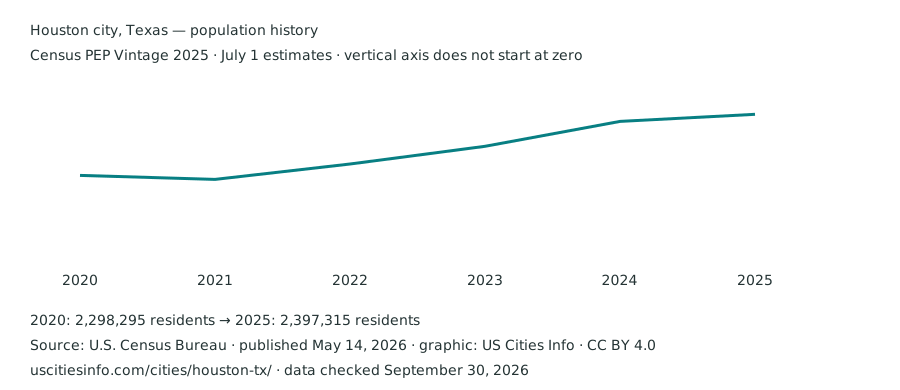
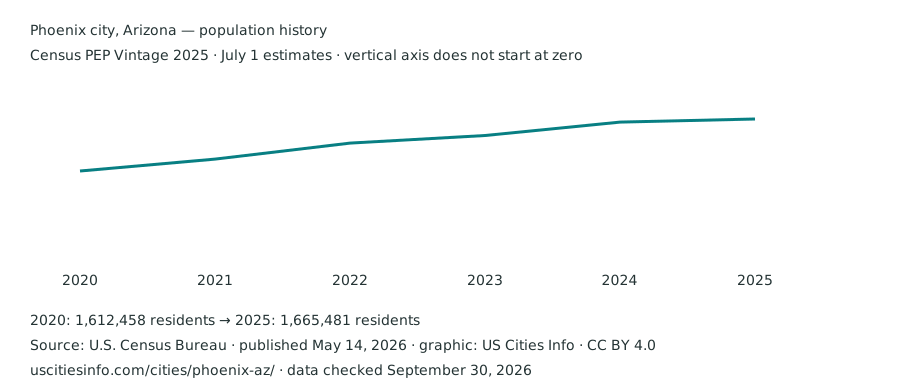
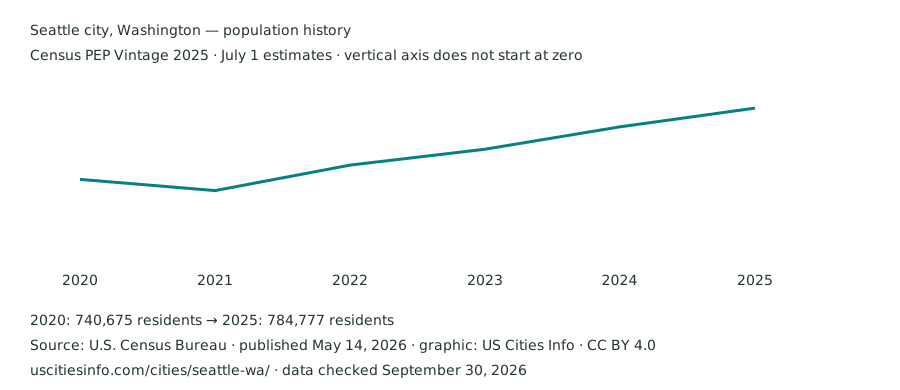
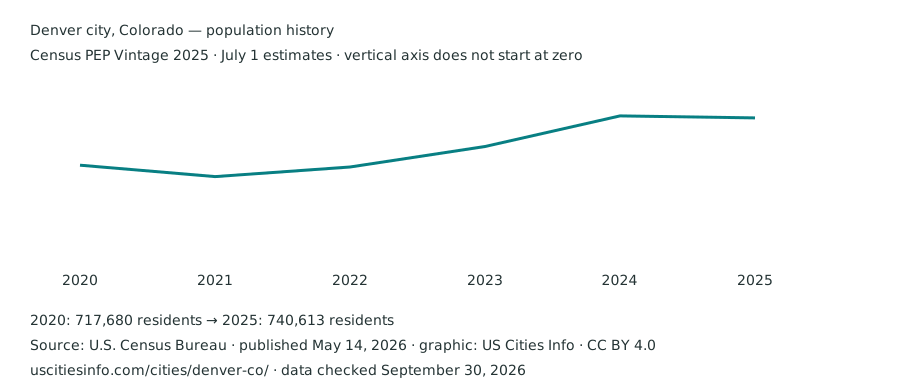
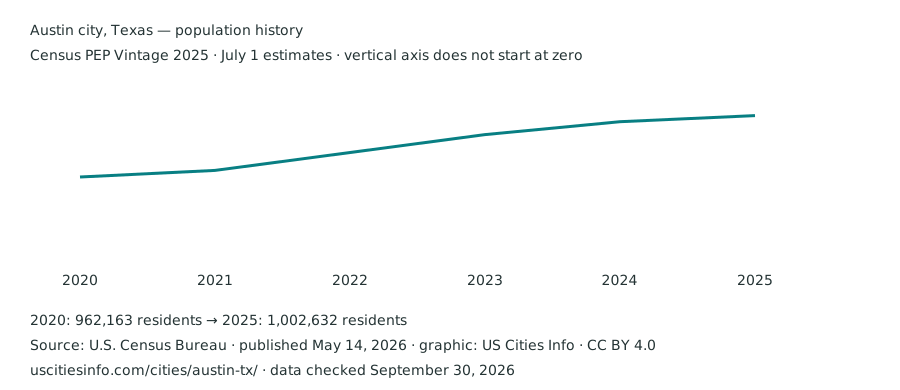
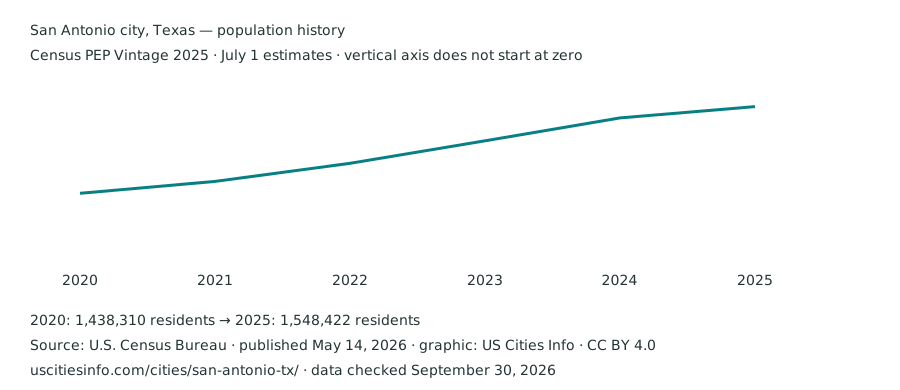
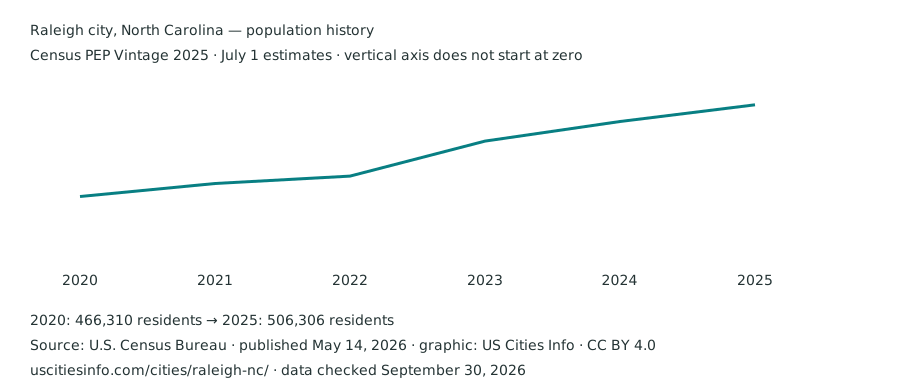
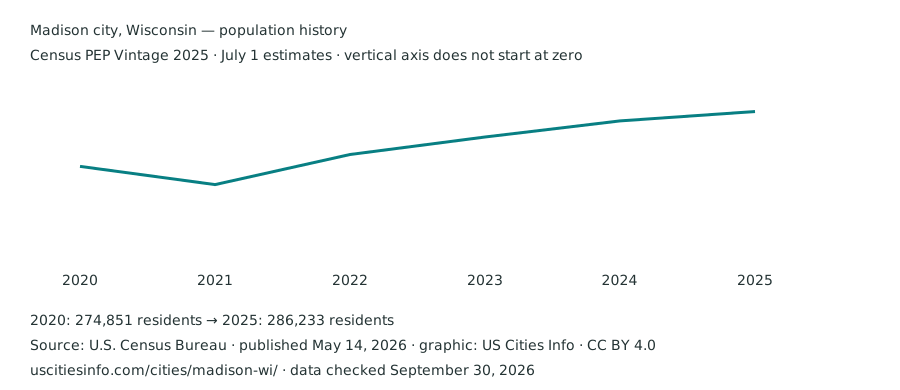
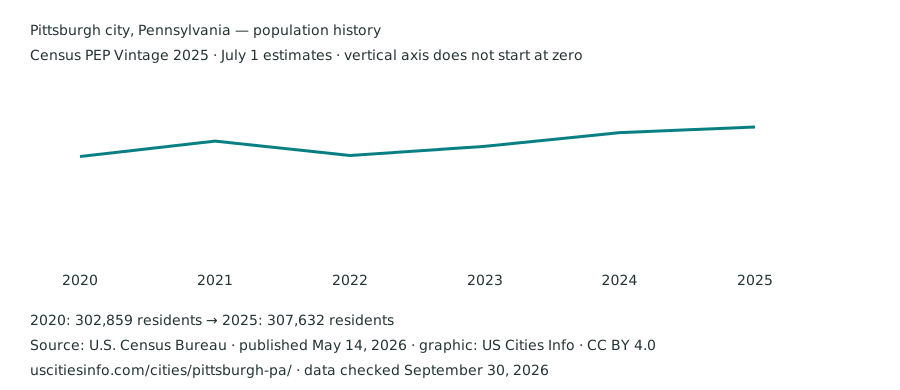
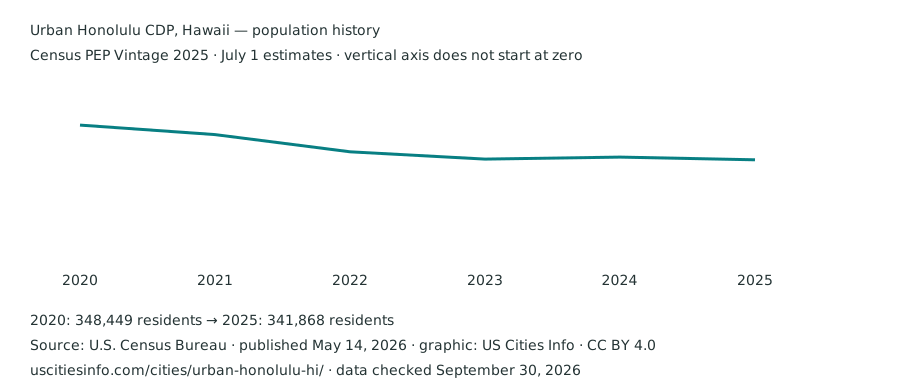
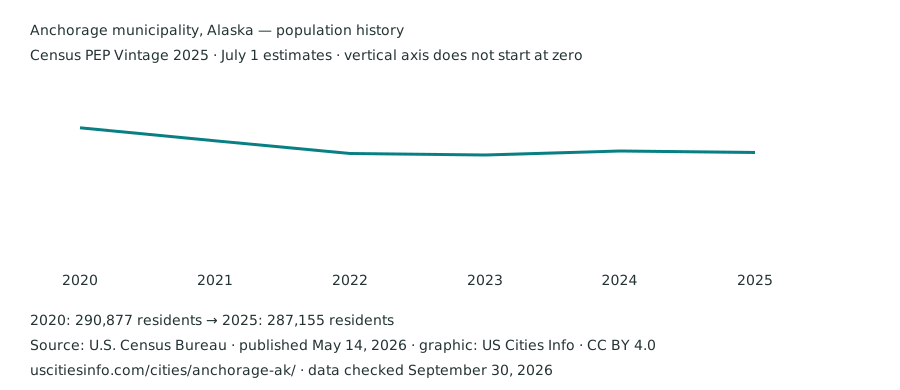
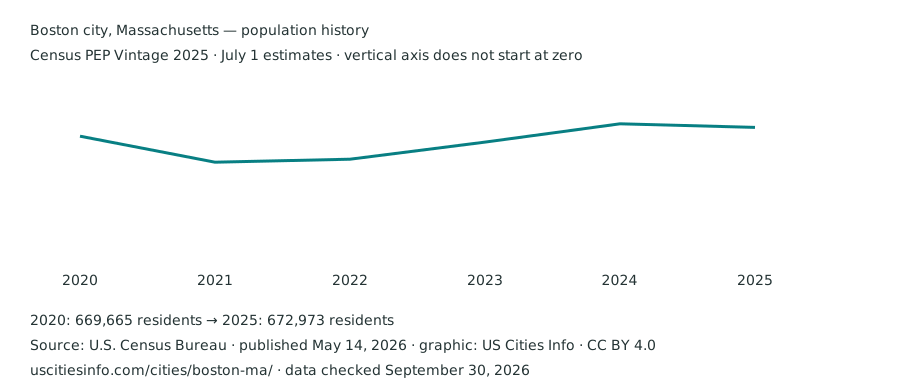
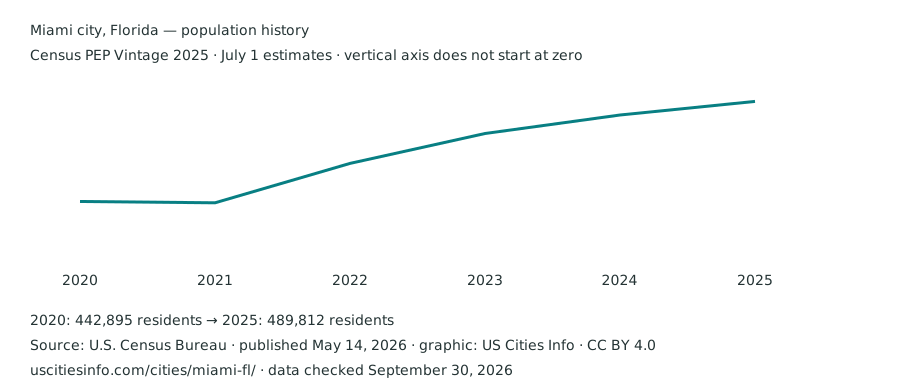
The locator map also exports the currently displayed city points as an SVG. Charts include source and reference labels. They use the within-vintage July 2020–2025 series and display the revised April 2020 base separately on city pages.
Data dictionary
- geoid
- Seven digits: state FIPS plus Census place code. Retain leading zeroes as text.
- population_2020 … population_2025
- Annual July 1 estimates, all from Census PEP Vintage 2025.
- base_2020
- Revised April 1, 2020 estimate base in the same vintage; not the July estimate.
- annual_change / annual_growth_percent
- 2025 minus 2024; percentage divides that difference by the 2024 estimate. Empty growth when the prior estimate is zero.
- national_rank / state_rank
- Competition rank by 2025 population in the PEP place directory.
- Estimate and MOE
- Per-place survey JSON stores each table as alternating original estimate and 90% MOE strings: [estimate001, moe001, estimate002, moe002, …]. Pair positions correspond to three-digit cell codes in the shared dictionary. Negative source sentinels and nonnumeric fields are unavailable, suppressed or inapplicable; interfaces and comparison files normalize them to null. Original strings remain available for inspection.
- Survey currency
- Income, rent, value and owner costs in 2024 inflation-adjusted dollars, from the 2020–2024 window.
Attribution and reuse
Underlying federal Census statistics and geographic data are public domain. Cite the Census Bureau, dataset, vintage or survey window, table and geography. When citing derived ranks, calculations or joined files, also credit US Cities Info and describe changes you make. Do not remove reference periods or replace unavailable values with zero.
Original maps and exported charts are offered under CC BY 4.0: attribute US Cities Info, identify the Census source and indicate modifications. A link to the source page is useful and need not pass search ranking value. These download terms do not grant permission to republish the site’s wordmark or substantial editorial text; see terms.
Directory CSV export contains every matching row, rather than just the current page of results. See methods for uncertainty and geography limits, original files for verification and the update record for this release’s date.